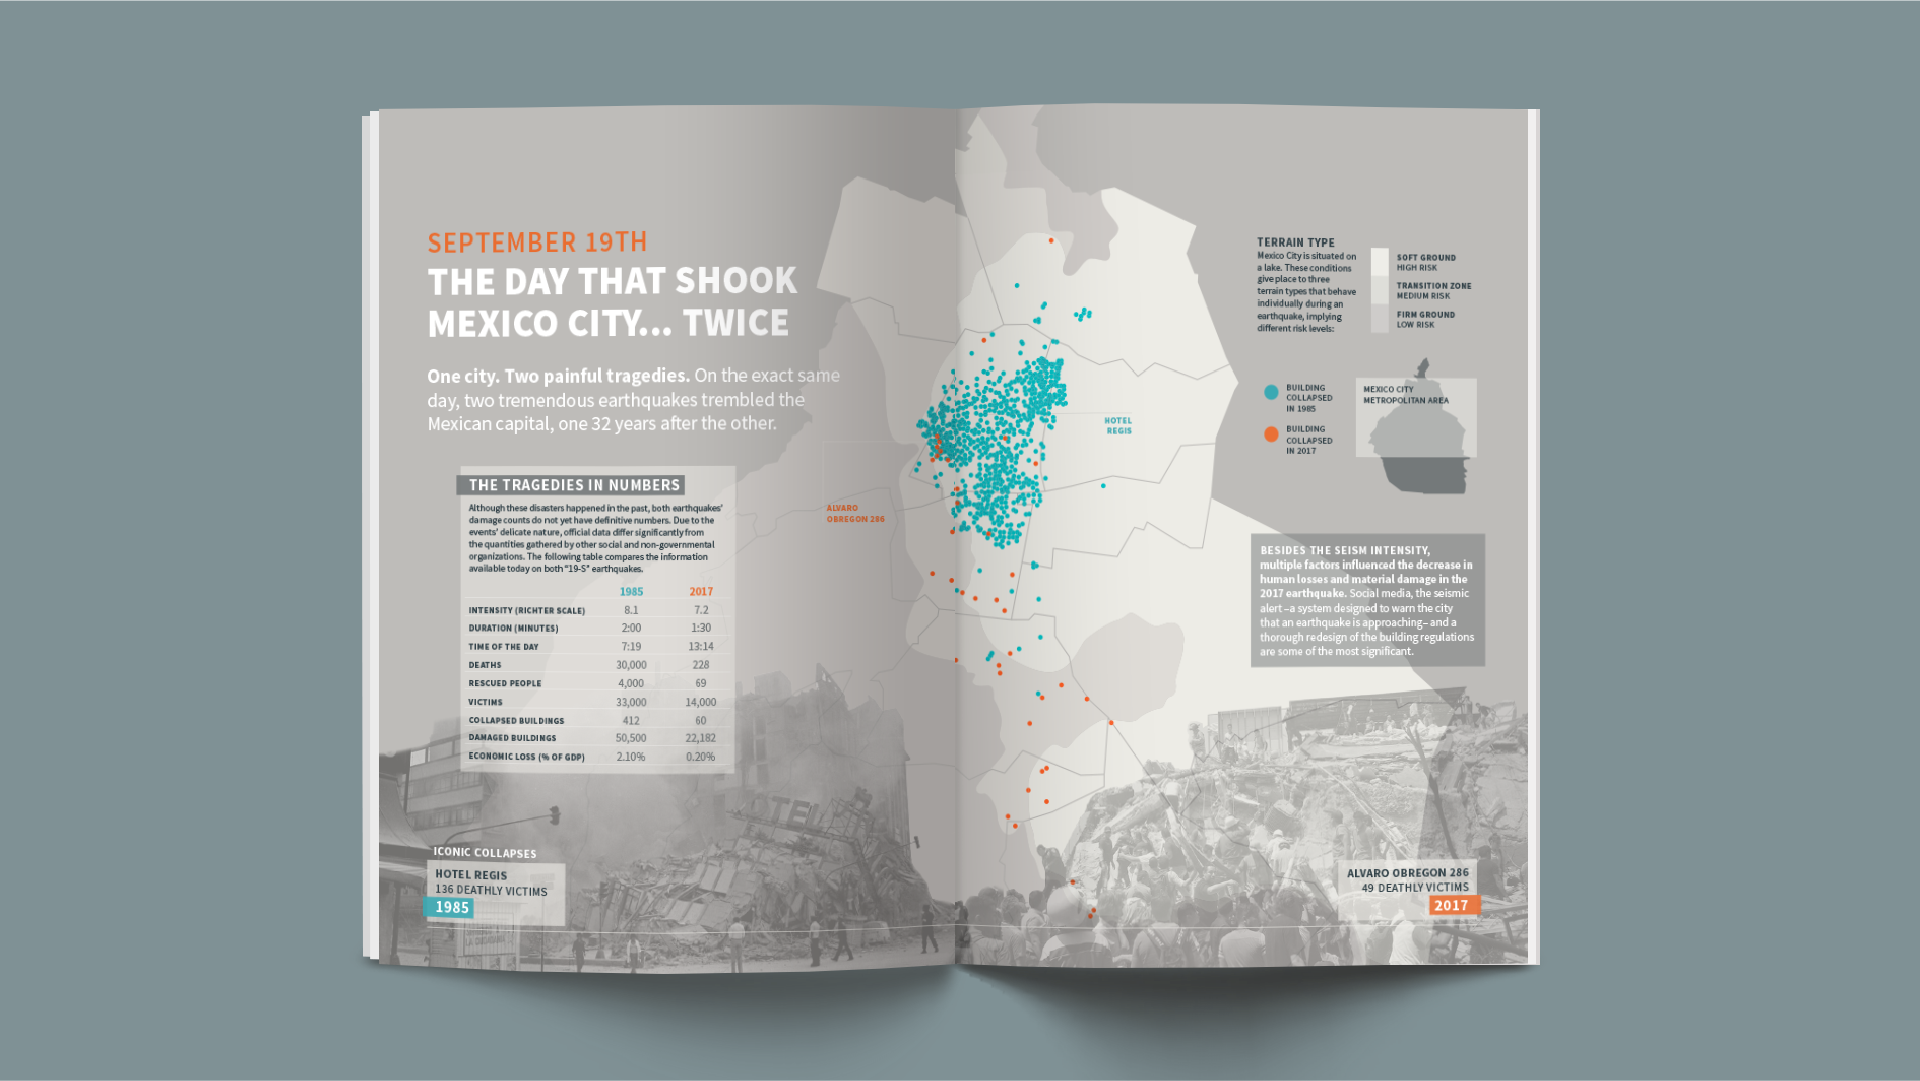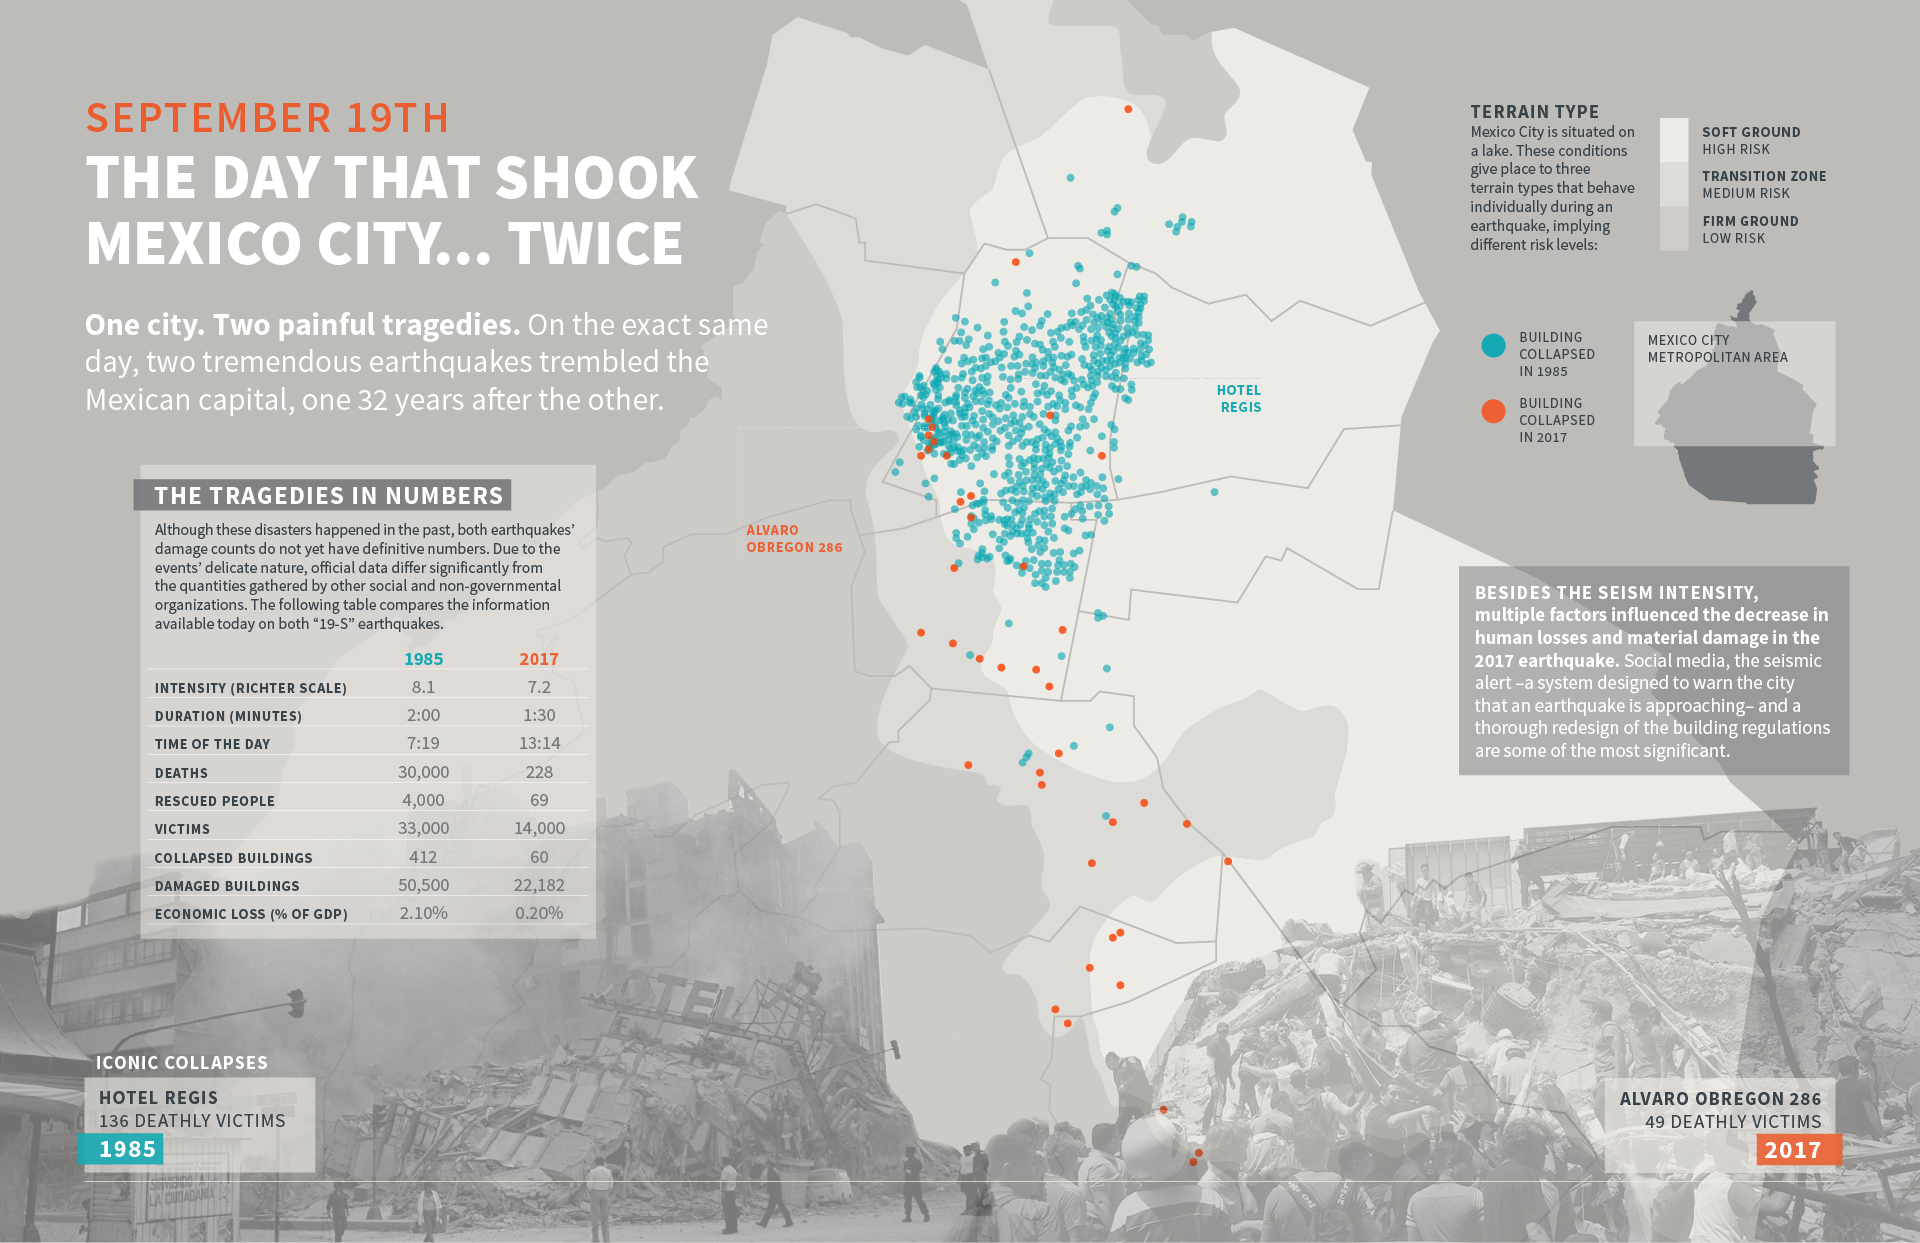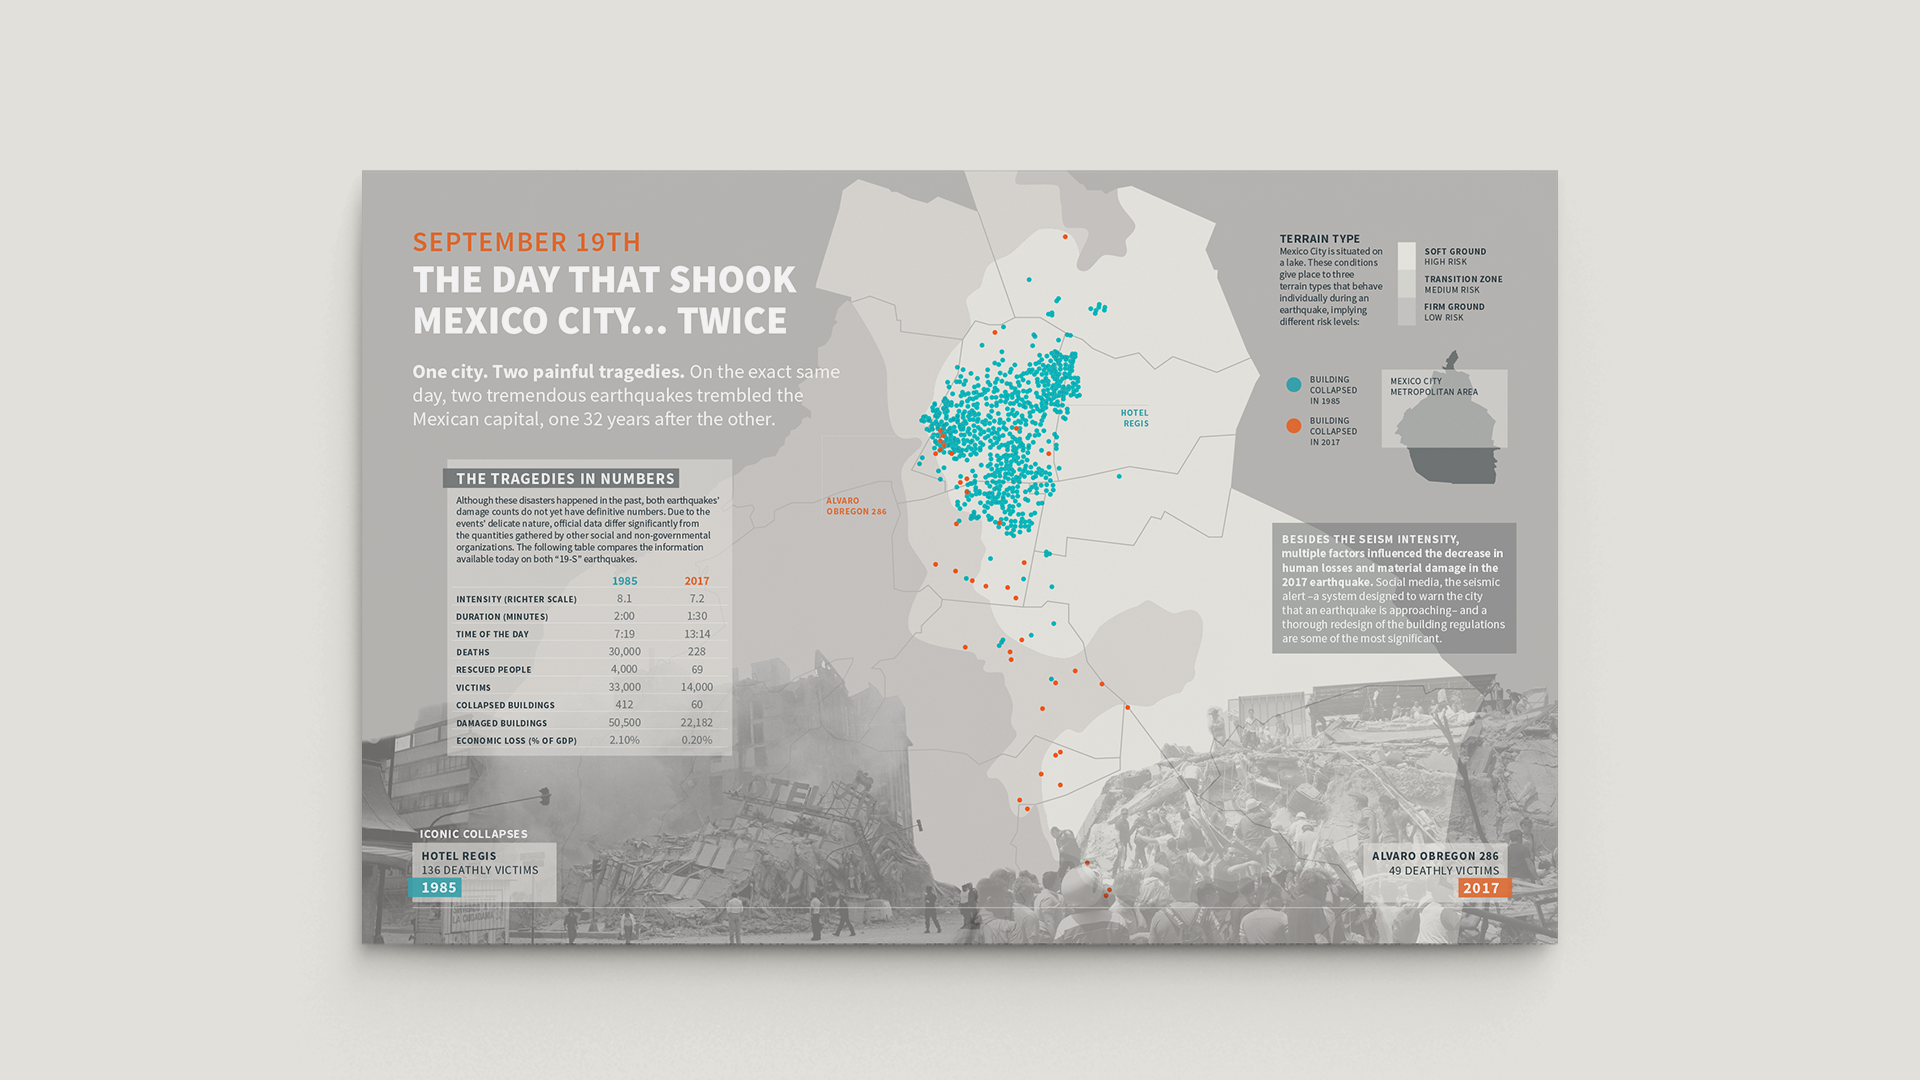

This editorial spread explores and visualizes the most important earthquakes in Mexico City's recent decades: 19S 1985 and 2017. It compares both disasters by color-coding the data for each event. This project was a geographical mapping assignment for MICA's "Foundations of Information and Data Visualization Literacy" course.